
How Much LLM Traffic Should a SaaS Company Expect?
We analysed 240,000 LLM visits across 64 B2B SaaS and tech companies over seven months. This report shows how much website traffic a typical company gets from ChatGPT, Perplexity, Claude, Gemini and other AI tools, how fast that figure is growing, and how to work out the number for your own site.
Contributor

Akilan Arumugam
SEO Specialist
In this article
Key Takeaways
LLM traffic means the visits that large language model tools, or LLMs, send to your site. ChatGPT, Perplexity, Claude and Gemini are the ones that show up in this study.
• LLM traffic runs at about 3% of organic traffic for the typical B2B SaaS company.
• It more than doubled in three months, from 1.3% of organic in April 2026 to 3.4% in June.
• Company size does not predict it. The same 3% applies at 5,000 monthly search visits and at 250,000.
• The spread is wide. The bottom quarter sit below 1.8% and the top tenth above 7.3%.
• Studies reporting "under 1%" divide by every visit a site gets. We divide by search visits only. Converted, the largest of them lands at 2.5% to 3.2%, where we do.
• A rising LLM share has two causes and only one is good news. Check whether search visits fell before you report a gain.
What Counts as LLM Traffic?
Every visit that reaches a website from an AI tool, instead of from a search engine, counts as LLM traffic. Some studies call the same thing AI referral traffic, and the two mean exactly the same thing.
Here is what one of those visits looks like. Someone asks ChatGPT a question, gets an answer, and clicks a link inside it. That click lands on a website, and the website's analytics software records it as a visit from ChatGPT.
At TripleDart we wanted to know how much of it a B2B SaaS company should be getting. So we tracked 64 SaaS and tech companies every month from January to July 2026, covering roughly 240,000 LLM visits.
For each company we compared two figures. One is the visits that came from AI tools. The other is the visits that came from Google and other search engines, which are normally called organic traffic.
For the typical company in June and July, LLM traffic came to about 3% of organic traffic. A company with 10,000 search visits in a month got roughly 300 visits from AI tools.
That figure is climbing quickly. In April it was 1.3%. By June it had reached 3.4%, so it more than doubled in two months. A target set in the spring was out of date by the summer.
What Is a Normal LLM Share of Organic Traffic?
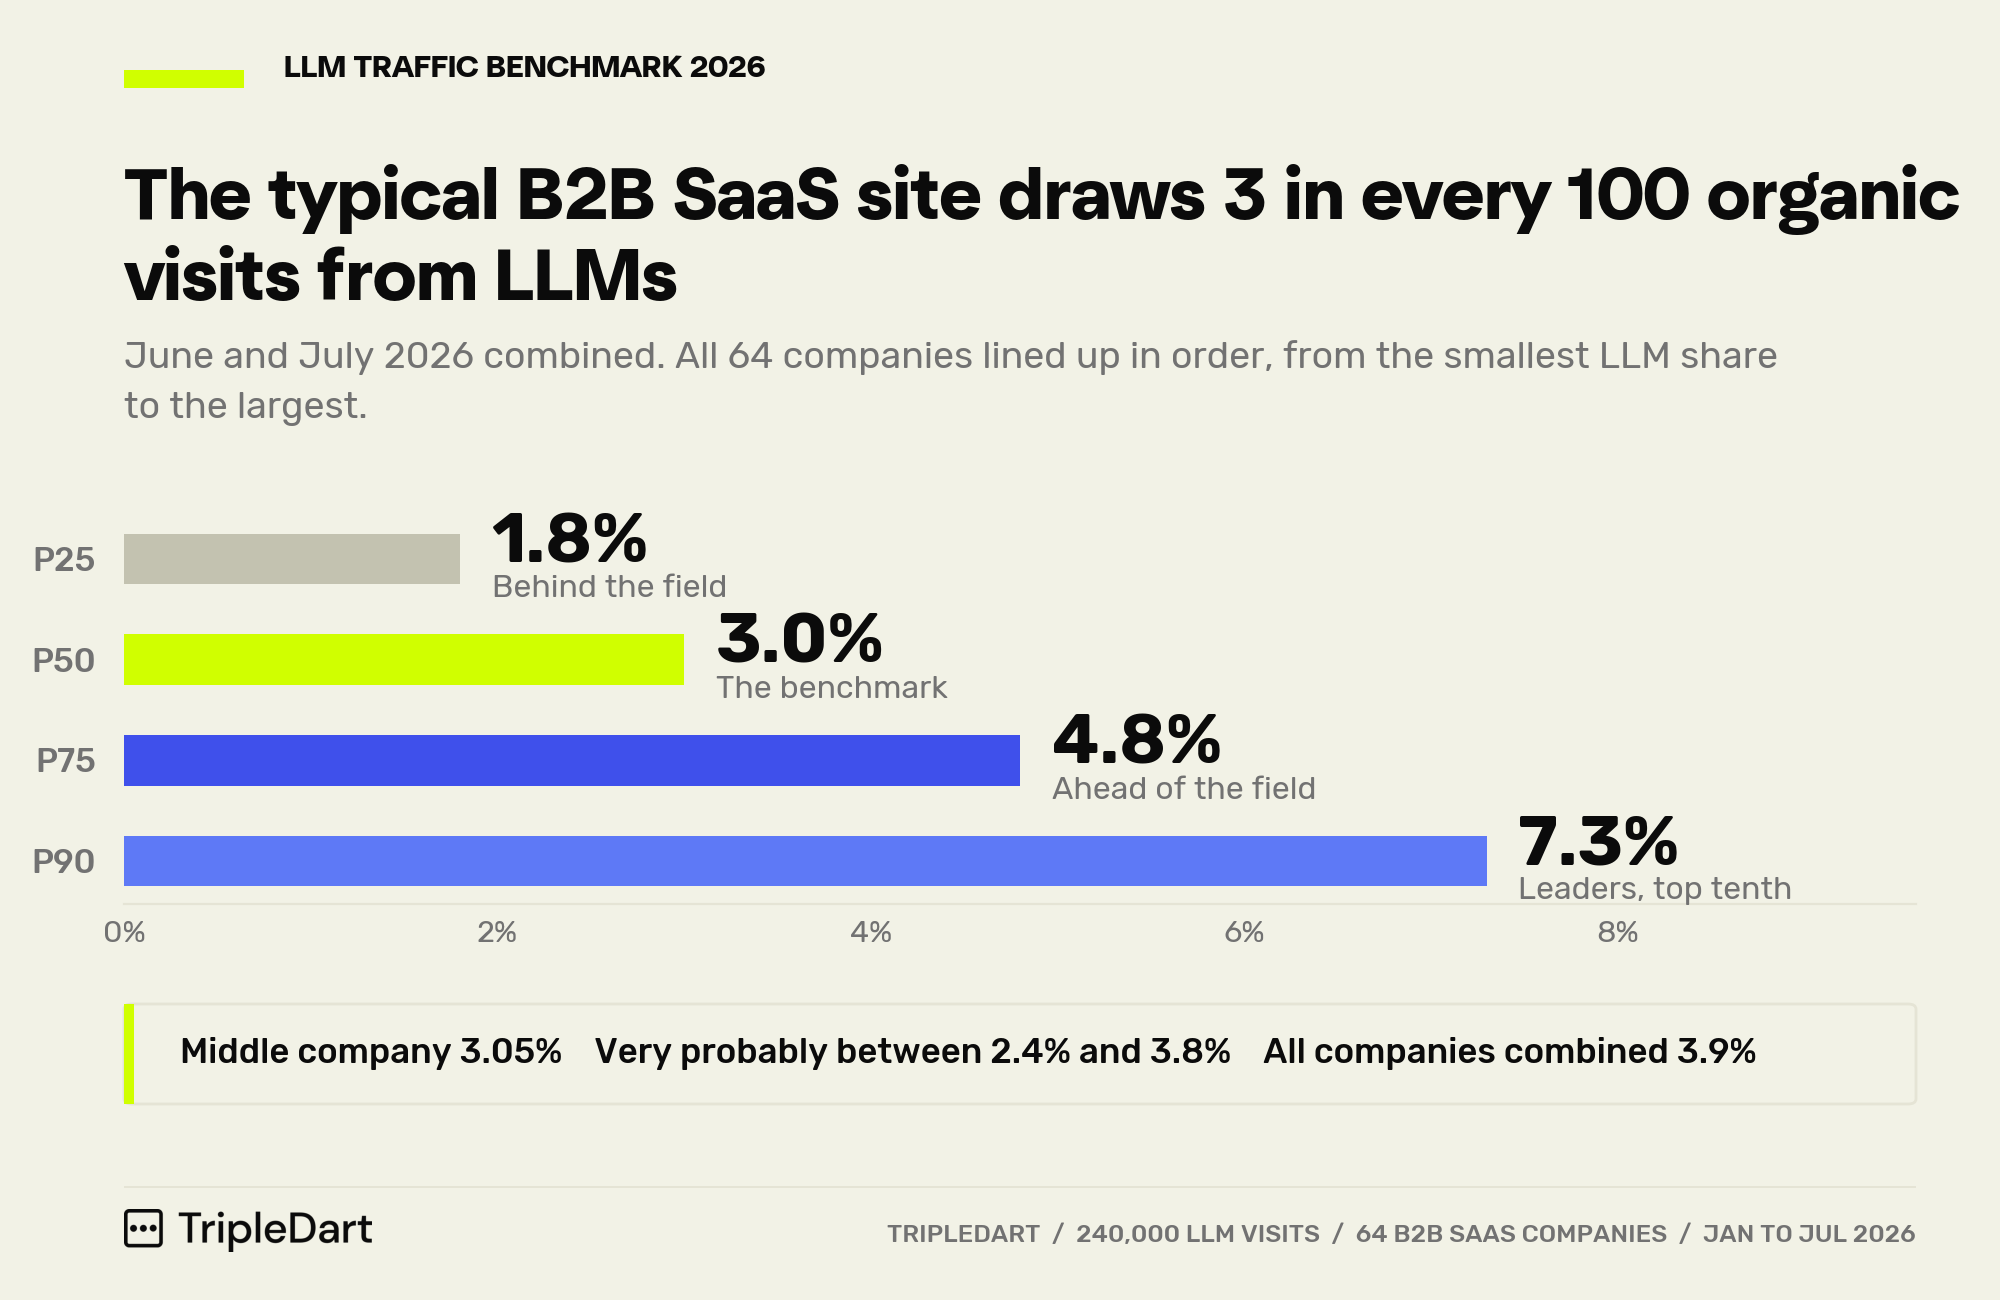
The typical B2B SaaS company gets LLM traffic worth about 3% of its organic traffic, meaning the visits that arrive from search engines. Divide your LLM visits by your search visits and you get your own figure, which we call your LLM share of organic traffic.
To find the typical figure, we lined all 64 companies up in a row, ordered by that share. At one end of the row sits the company with the smallest share, and at the other end sits the company with the largest. The company standing in the exact middle gets 3.05%.
The chart below marks four points along that row, labelled P25, P50, P75 and P90. The number after the P is how far along the row each point sits. P25 is a quarter of the way up, P50 is halfway, and P90 is nine tenths of the way.
Why the Median Works Better Than an Average: the Top Tenth Sit Above 7.3%
The median is just the middle company in that row of 64, and we used it instead of an average on purpose. The top tenth of our companies sit at 7.3% or higher, which is more than double the typical figure.
An average would let those few pull the figure upward. Most companies would then look like they were falling behind, when they were in fact doing perfectly normally. The median gives a fairer picture of normal.
What the Four Percentile Bands Mean, From 1.8% to 7.3%
A percentile is a marker showing how far along the row a figure sits. We marked four of them. The middle one is the 3.05% benchmark from above, which we round to 3.0% everywhere else for readability.
• P25 is 1.8%. A quarter of the way along the row. Three companies in every four get more LLM traffic than this.
• P50 is 3.0%. Halfway along the row, and the benchmark for this report. P50 is another name for the median.
• P75 is 4.8%. Three quarters of the way along. Only one company in four gets more than this.
• P90 is 7.3%. Nine tenths of the way along. Only one company in ten gets more than this.
Divide last month's LLM visits by last month's search visits, then find that figure on the row. Below 1.8% you are behind comparable SaaS companies. Above 4.8% you are ahead of most of them.
We also calculated the same thing a second way. We added up every LLM visit across all 64 companies, then divided by every search visit across all 64.
That method gives 3.9%. It comes out higher because it lets the biggest sites count for more, and those sites happen to get a bit more LLM traffic right now.
Both methods are useful, and they answer different questions. The middle company tells you whether your own site is normal. The all-companies total tells you how large LLM traffic has grown as a source of visits, next to search, ads and everything else.
Our AI SEO statistics roundup collects the wider market figures this study sits inside.
Both of those numbers come from June and July. Earlier in the year they were roughly half as high.
How Fast Is LLM Traffic Growing for B2B SaaS?
The figure more than doubled between April and June 2026. For the first four months of the year, the typical company's LLM traffic stayed between 1.3% and 1.9% of its search traffic. In May it began to move, and by June and July it had settled at a clearly higher level.
Grouping the months together makes the change easier to read. Across January to April, the middle company sat at 1.6%. Across May to July, the middle company sat at 2.6%.
That is growth of 64%, worked out on the unrounded monthly figures behind those two rounded numbers. Counted in percentage points, the typical company gained one point of LLM share in three months.
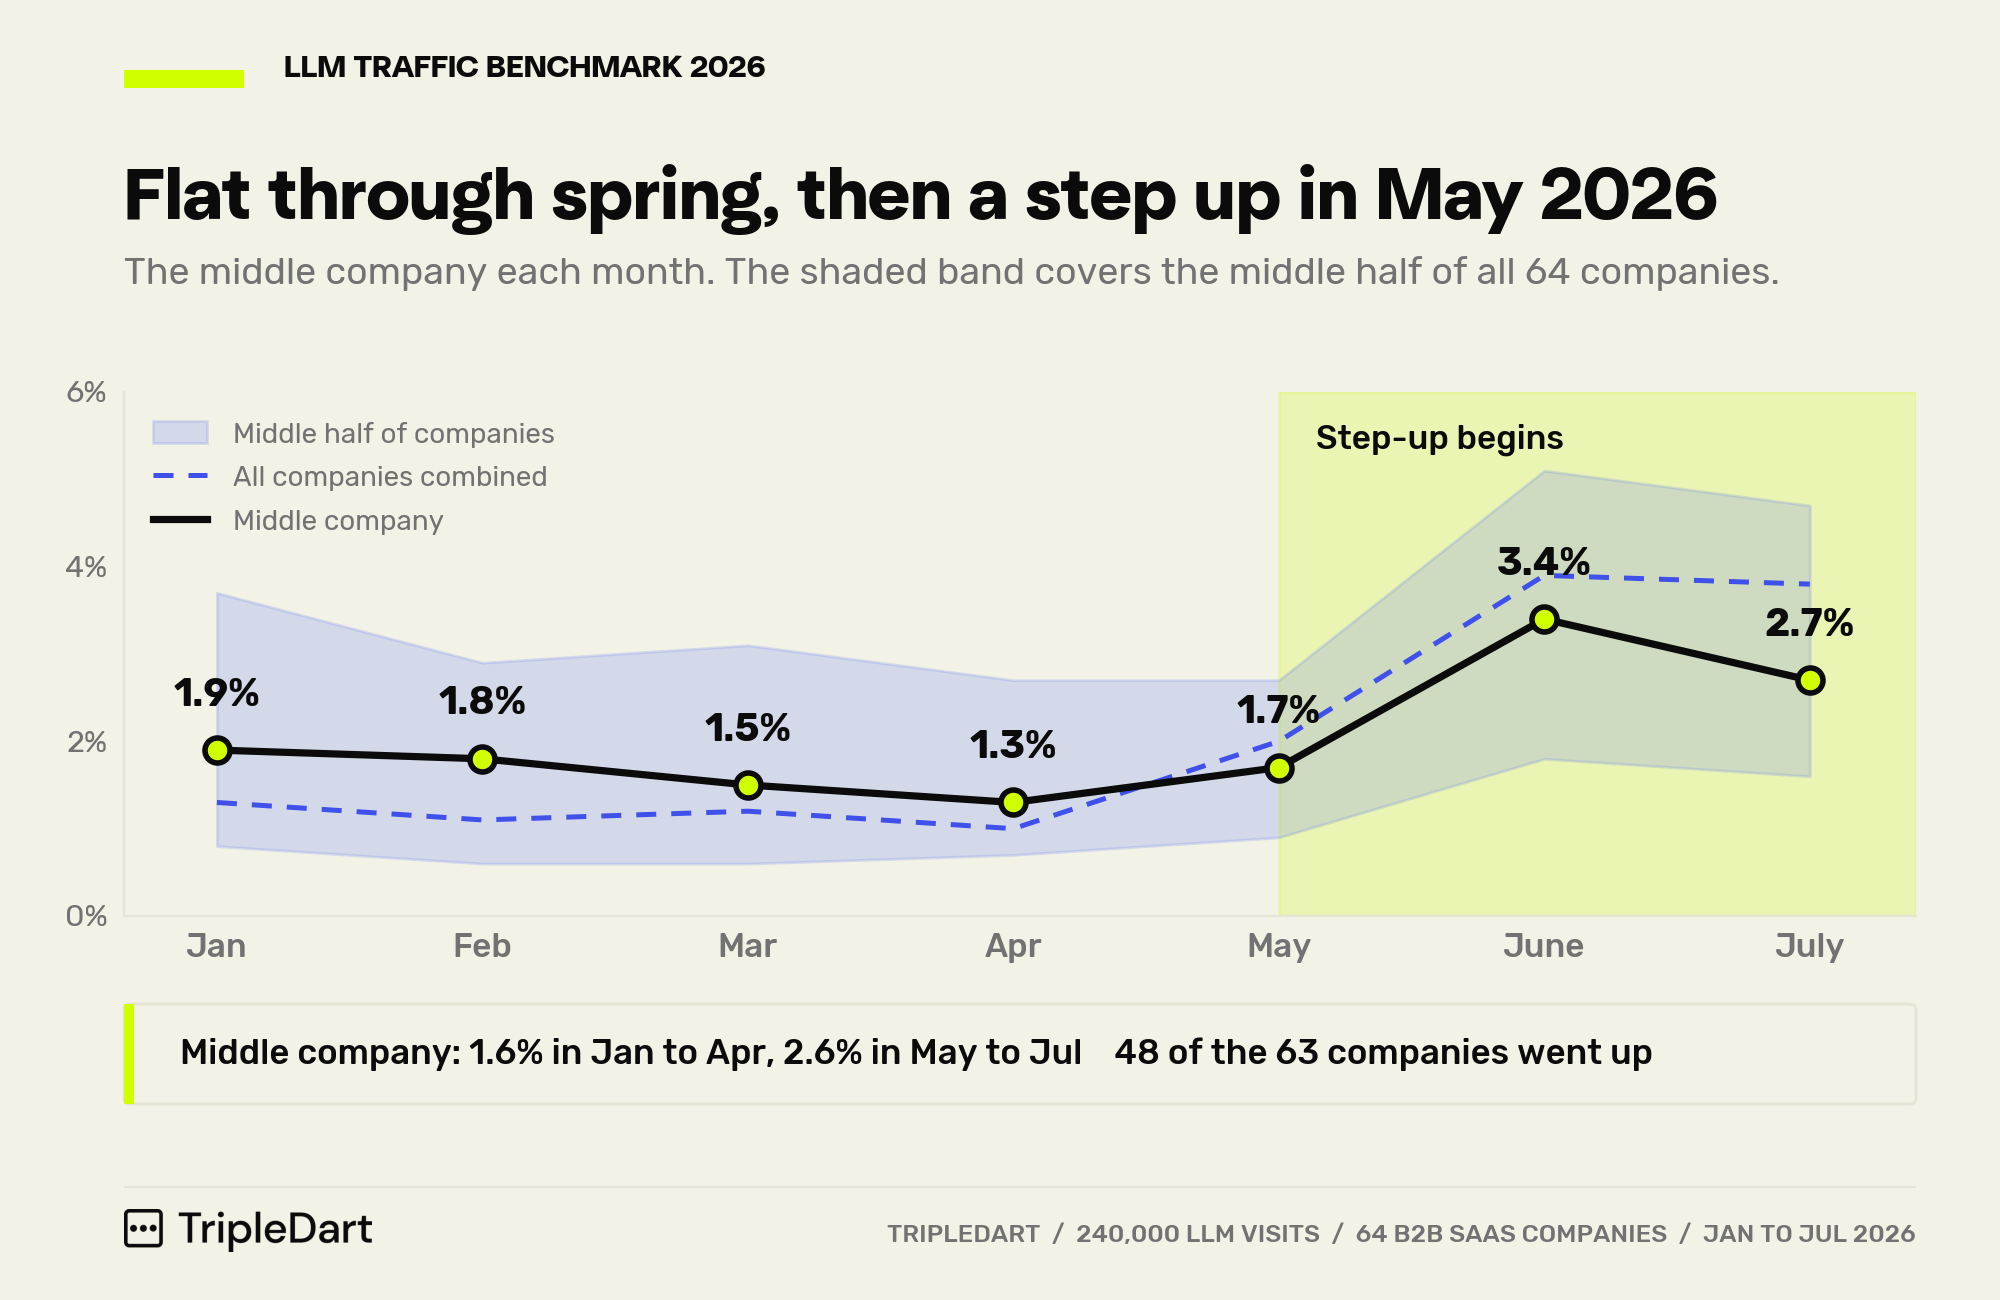
Our first thought was that a handful of unusual companies had pulled the middle upward. So we checked each company against its own earlier months instead of against the group, and almost all of them had moved in the same direction.
48 of the 63 companies with a full set of data finished higher than they started. The other 15 did not.
A statistical test asks how often a 48-out-of-63 split like that would turn up by pure chance. The answer is about 5 times in every 100,000, so the rise is a genuine pattern across the group.
The jump lands between May and June, and a far larger study found the same thing in the same month. SE Ranking examined ChatGPT referral traffic across 101,574 websites.
The number of visits ChatGPT sent those sites rose 36.7% from April to May 2026, the biggest one-month jump they had recorded.
Two studies of very different sizes therefore point to the same month. The next question is whether the 3% figure holds for companies of every size.
Does a Bigger Site Get a Bigger Share of LLM Traffic?
No. A bigger site gets more LLM visits, but it does not get a bigger percentage. Take a site with 5,000 search visits a month and a site with 250,000 a month. Both tend to land near the same 3%, which is what allows one benchmark to cover both.
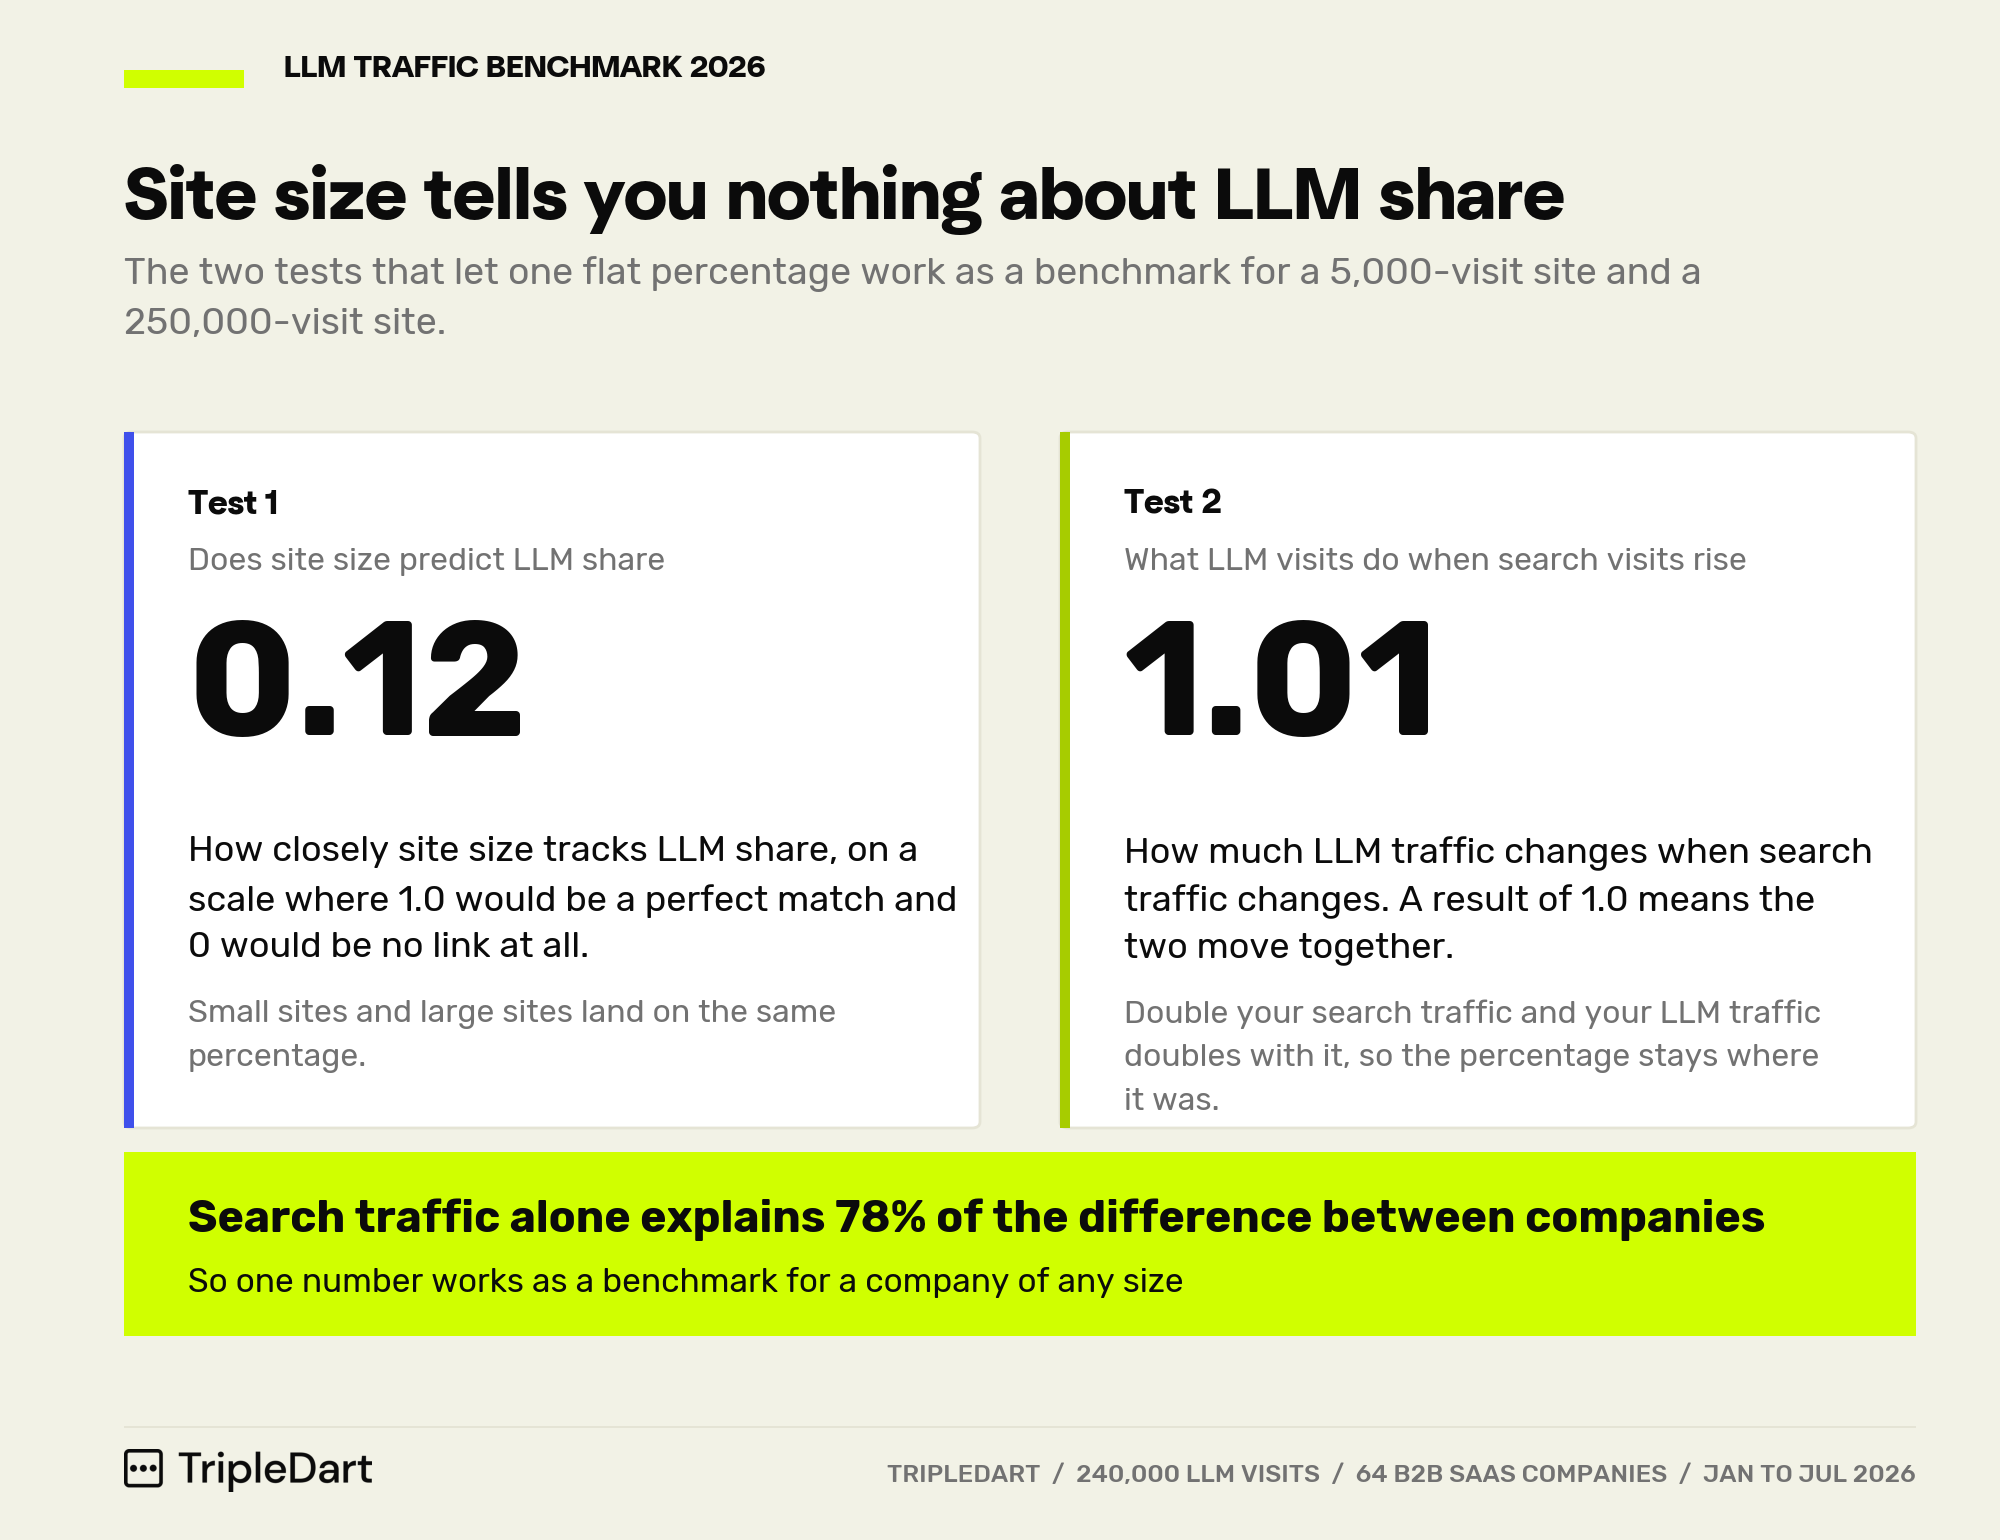
We ran two checks. The first asks whether large sites tend to have a higher LLM share than small ones.
It came back at 0.12, on a scale where 1.0 would mean a perfect match and 0 would mean no connection at all. A correlation of 0.12 is close to nothing, so a company's size tells you almost nothing about its LLM share.
The second check asks what happens to LLM visits when search visits rise. It came back at 1.01, which means the two rise together almost exactly.
Double your search traffic and your LLM traffic doubles as well, so the percentage stays where it was. Statisticians call that an elasticity of 1.
Knowing a company's search traffic gets you 78% of the way to predicting its LLM visits. The remaining 22% comes down to everything else about the company, such as what it sells and how its pages are written.
For something as new as LLM traffic, 78% is a strong prediction from a single input. It is also why we can publish one number instead of a separate figure for every size of company.
The result works in both directions. A small company cannot dismiss the 3% as a figure that only applies to big brands. A large company gets no credit for being large.
Because the percentage holds at any size, you can use it to work out the figure for your own site.
How Many LLM Visits Should You Expect at Your Organic Traffic Level?
Multiply your monthly search visits by 0.03. The table below does that arithmetic for six common traffic levels. The outer columns use the 1.8% and 4.8% cut-offs from earlier, so you can see the range as well as the middle. Find the row closest to your own site and read across.
Keep two things in mind when you use it. Compare yourself against the current month instead of a figure from last quarter, because the whole range keeps moving upward.
And treat your result as a position among other companies. A company at 2% while the typical company sits at 3% is close to normal. A company at 0.5% has a gap worth working on this quarter.
One objection tends to come up at this point. You have probably seen a study saying LLM traffic is under 1% of all traffic, and it sounds like a flat contradiction of everything above. The disagreement turns out to be about the denominator, meaning the number you divide by.
Why Do Some Studies Say LLM Traffic Is Under 1%?
Those studies divide by a different total. They measure the same visits, which they usually call AI referral traffic, against every visit a website gets from every source. We compare LLM visits against search visits only.
A website gets many more visits in total than it gets from search alone. Dividing by the larger total produces a much smaller percentage.
Convert one of those studies to our measure and the two agree. The largest one published so far comes from Conductor, an SEO software company, and it covers 13,770 websites and 3.3 billion visits across 10 industries.
Conductor put LLM traffic at 1.08% of all visits. In the three industries where search pulled in the most, search accounted for 33.8% to 42.4% of all visits.
Divide 1.08 by those two search figures and LLM traffic works out at 2.5% to 3.2% of search traffic. Our own middle company sits at 3.05%.
The 1% figure and our 3% figure describe the same thing measured two different ways. The largest independent study published lands almost exactly where we do.
Every other published study agrees on the direction:
• Search Engine Land, 13 months of analytics data: LLM traffic grew 80% from one six-month stretch to the next, and roughly tripled between January and December 2025.
• Search Engine Land, 166 analytics accounts and 6.77M visits: monthly LLM visits grew almost 10 times between November 2024 and May 2026. Of the visits they could trace back to a source, 92.4% came from ChatGPT.
• Previsible, 2025 AI Traffic Report: LLM visits rose 527% between January and May 2025, going from 17,076 to 107,100.
None of these studies makes LLM traffic look large yet, and all of them show it growing faster than any other channel a marketing team reports on. A company sitting near 3% of organic in mid-2026 is where the market is.
Every one of these figures is one number divided by another, though, and both of those numbers can move.
The Denominator Check: A Rising LLM Share Has Two Causes, and One Is Bad News
Your LLM share is a division. LLM visits go on top, search visits go underneath, and the number underneath is called the denominator.
The share rises when LLM visits increase. It also rises when search visits fall while LLM visits stay flat.
In Google Analytics, or GA4 as the current version is known, the share looks identical in both cases. A rising share on its own therefore tells you nothing about whether you are winning.
Search traffic is under pressure across B2B SaaS at the moment, which is why we wrote the Google traffic recovery playbook. So plenty of teams are watching their LLM share rise because search fell, and reporting it upward as though LLM visits had grown.
The check takes 30 seconds:
1. Look up your LLM visits as a raw count for the current month and for the same month last quarter.
2. Look up your search visits for those same two months.
3. Compare which direction each one moved. LLM visits up with search visits flat means you grew. LLM visits flat with search visits down means you shrank, and the percentage hid it.
4. Report both counts next to the percentage, because nobody can check a percentage on its own.
Every LLM share you put in front of a leadership team should arrive with both of its inputs visible. The share is the headline. The two visit counts are the evidence.
Once you have run that check, the 3% benchmark becomes something you can act on.
What to Do With the 3% Benchmark This Quarter
The scorecard below gives you the one action that fits your own band. Underneath it are the four moves we would run for any client, whichever band they land in, in the order we would run them.
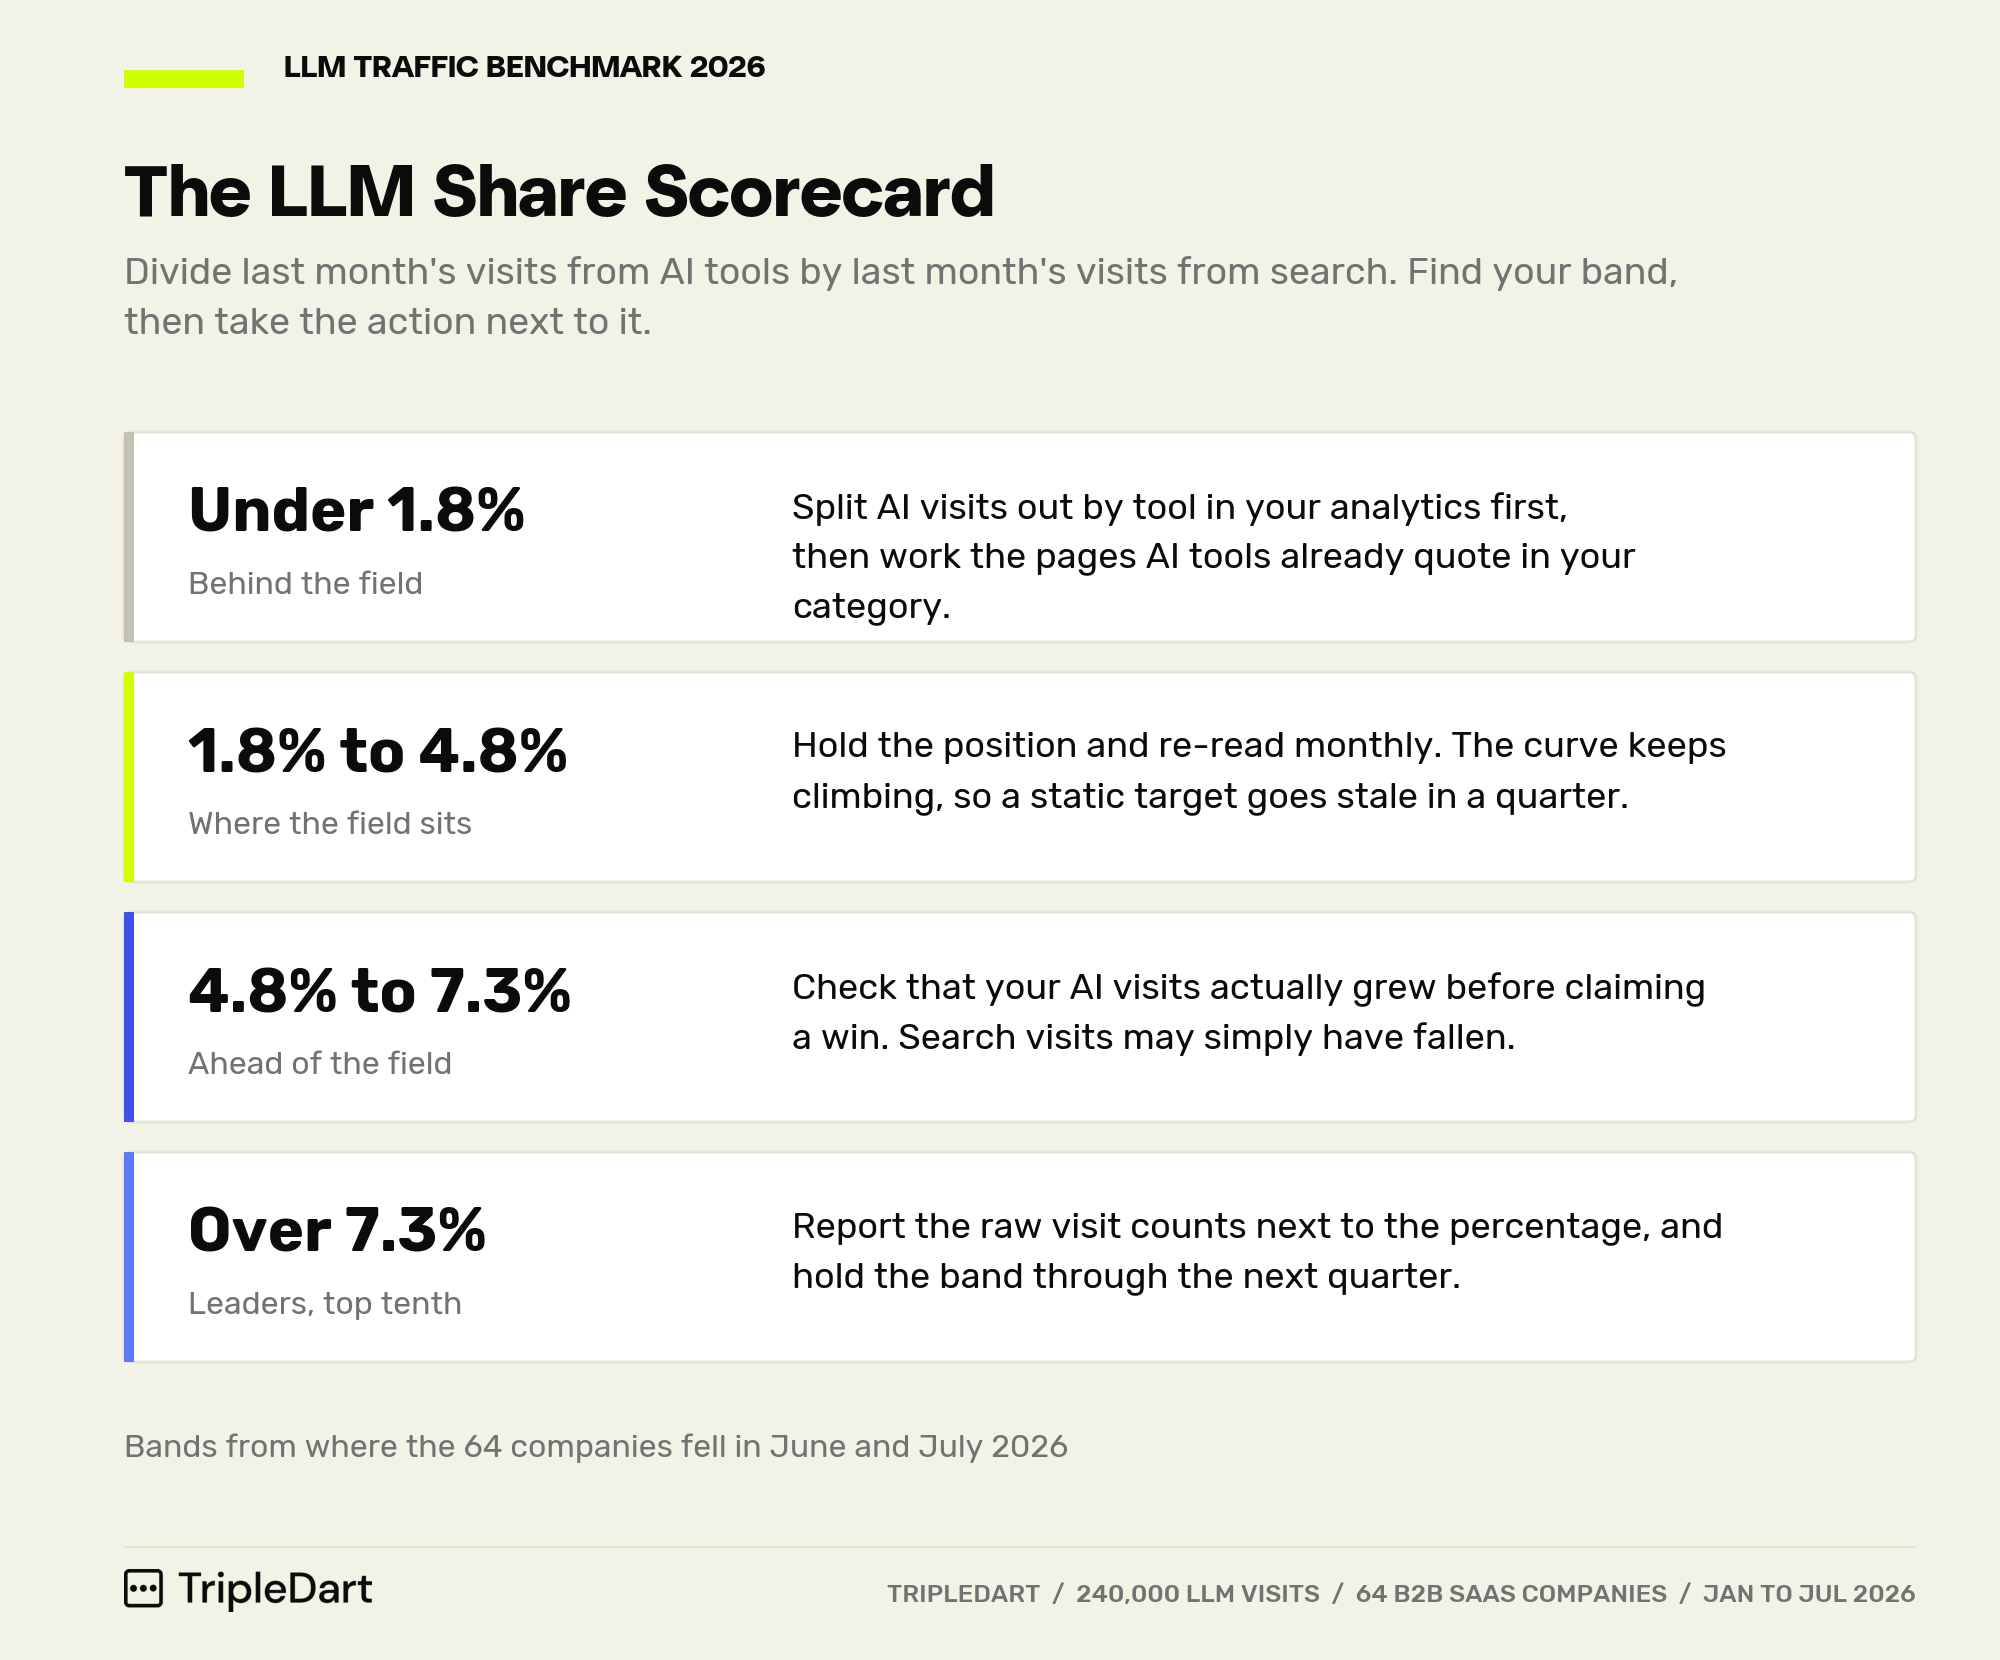
The first two moves take minutes. The last two are ongoing work that plays out over months.
Set the Target at 3% of Organic, and Reset It Every Month
Take your monthly search visits and multiply by 0.03. That is roughly the number of LLM visits a typical SaaS company in your position sees.
The whole range keeps moving upward, so a target you set once a year goes out of date within a quarter. Check your position against the current month, every month.
Separate the Two Reasons Your Share Could Be Climbing
Run the denominator check before any LLM figure goes into a board deck. Teams that skip it end up reporting a drop in search traffic as an AI search win, and the correction arrives a quarter later.
Size Predicts Nothing, So the Same 3% Applies at 5,000 and 250,000 Visits
A company's LLM share has no connection to how much traffic it gets. A small site at 0.6% is looking at a gap it can close with work, because nothing about its size is holding the number down. A large site at 1.2% has the same gap, and its size will not close it for free.
Split LLM Visits Out in Google Analytics Before You Try to Grow the Share
Start by making the number visible. Most analytics setups dump LLM visits into a bucket called direct traffic, which is where visits go when the software cannot tell where they came from. Separate them out by tool first, so you can see ChatGPT apart from Perplexity apart from Gemini.
Then comes the work of getting quoted more often, which the industry calls generative engine optimization, or GEO. Our guides to GEO metrics and GEO techniques cover which questions to track and how to make your pages easier for AI tools to quote.
How We Ran the Study: 64 Companies, 7 Months, 448 Company-Months
Sample: 64 SaaS and Tech Companies, Every Month Complete
We tracked 64 SaaS and B2B tech companies for seven consecutive months, from January to July 2026. That gives 448 company-months of data with no gaps anywhere in the set, and every company carries a tag for its industry sub-category.
Across the panel the study covers roughly 240,000 LLM visits and the organic search visits they are measured against.
Metric: LLM Visits Divided by Organic Search Visits
We calculated each company's LLM share as its LLM referral visits divided by its organic search visits. Analytics tools count these as sessions, which is their word for one person's visit to a site.
LLM visits are the ones a company's own analytics attributes to ChatGPT, Perplexity, Claude, Gemini, Google AI surfaces and Copilot.
We calculated every month from raw counts, instead of averaging figures that had already been rounded. That keeps the monthly numbers comparable with each other.
Benchmark Construction: June and July Combined, Reported Two Ways
The headline figure combines June and July, because those two months have the most consistent data.
We report the middle company out of the 64, which answers "is my site normal?" We also report all LLM visits divided by all search visits, which answers "how large is this channel?"
Statistical Tests: Bootstrap, Wilcoxon, Spearman, Log-Log Regression
• To test how firm the middle figure is, we re-drew the sample 5,000 times at random and recalculated it each time, a method called bootstrap resampling. The June to July figure is 3.05%, and 95% of those redraws landed between 2.4% and 3.8%.
• For the growth finding we ran a Wilcoxon paired signed-rank test, comparing each company's May to July average against its own January to April average (p = 0.00005).
• For the size finding we ran a Spearman rank correlation (rho = 0.12, p = 0.34) and a log-log elasticity regression of LLM visits on search visits (slope 1.01, 95% interval 0.87 to 1.14, R² = 0.78). That R² of 0.78 is the 78% quoted earlier.
Get Your Own Number Scored
We run this study every quarter for the B2B SaaS accounts we work with, alongside the citation data that sits behind it.
If you want your own figure scored against these bands, book a growth call. We will compare your analytics against the 64 companies and tell you which band you land in.
Frequently Asked Questions
What LLM Traffic Should a SaaS Company Expect?
About 3% of your organic search traffic as of July 2026. Below 1.8% puts you behind the field, and above 4.8% puts you ahead of it. Multiply your monthly search visits by 0.03 to get a working target.
What Counts as LLM Traffic in Google Analytics?
LLM traffic covers the visits that arrive from a large language model tool instead of from a search engine, an ad or a direct type-in. In our study that means ChatGPT, Perplexity, Gemini, Google AI surfaces and Copilot.
Most analytics setups file these visits under direct traffic until you split them out by tool.
Which AI Tool Sends the Most Traffic to B2B Sites?
ChatGPT sends the most by a wide margin. Across 166 analytics accounts and 6.77M visits, Search Engine Land found that 92.4% of the LLM visits they could trace back to a source came from ChatGPT. Perplexity, Gemini and Copilot split what is left.
How Much Did LLM Traffic Grow in 2026?
The middle company rose 64% between the January to April period and the May to July period, going from 1.6% of search traffic to 2.6%. June was the highest single month at 3.4%. Every outside study we checked reports growth in the same direction.
Why Benchmark Against Organic Instead of Total Traffic?
Search is the channel LLM referrals draw from most directly, and most teams already have their search number to hand. Measuring LLM traffic against search gives you a figure you can act on. Measuring it against all traffic gives you a number so small it looks like a rounding error.
How Does This Square With Studies Saying LLM Traffic Is Under 1%?
Those studies divide LLM visits by every visit a site gets, and we divide by search visits only.
Conductor's study of 3.3 billion visits put LLM traffic at 1.08% of all visits. In its three most search-heavy industries, search took 33.8% to 42.4%. Divide one by the other and you get 2.5% to 3.2% of search traffic, which is our number.
How Often Should We Re-Benchmark?
Every month while the figure is moving this quickly. The middle company went from 1.3% in April to 3.4% in June, so anything set in spring was already wrong by July.
Quarterly checks are enough once the month-to-month movement drops below a percentage point. Our AI SEO guide covers the rest of what to track alongside it.